News
The Data Lab: A Simulated Year of Measurements and a Toolbox Against Interference
ℹ️ Hinweis: Die Bilder in diesen Beiträgen sind KI-generiert.
← Alle NewsBioComm's Data Lab is already up and running, with clearly labeled simulation data. It tells us nothing about fungi, but a lot about whether our infrastructure holds up and how we're preparing for our biggest challenge: interference.
05.11.2026 · en
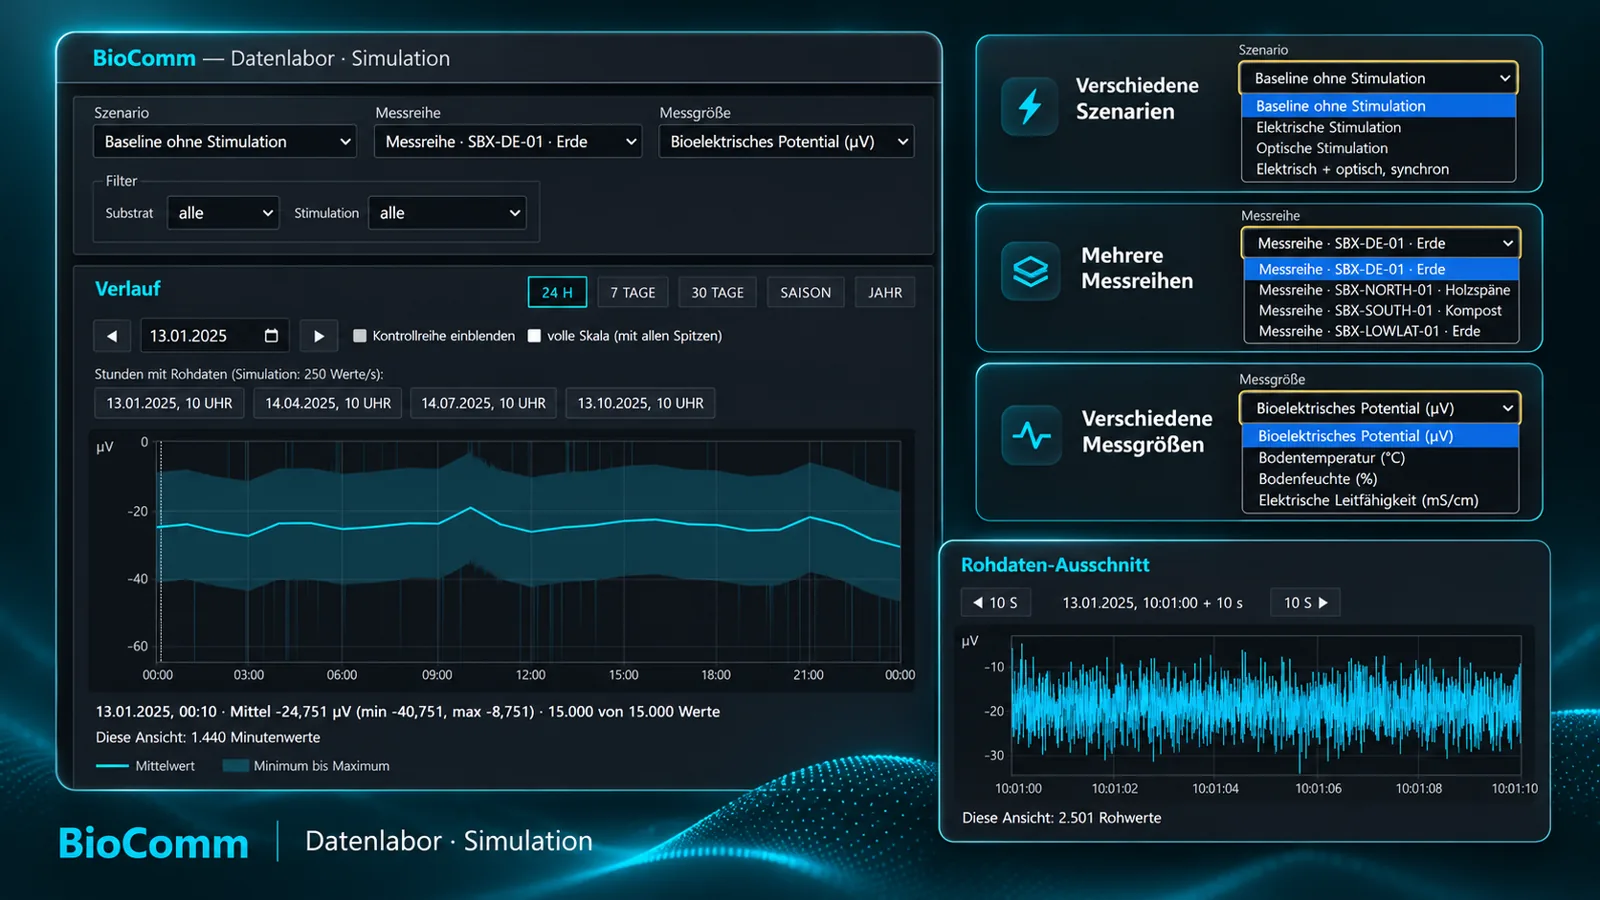
At OpenMycoNet, measurement data comes first, everything else second. So that the data from the first real measurement nodes doesn't end up in an improvised environment, we've already built and tested the Data Lab.
What is the Data Lab?
It's the environment within the BioComm software where measurement series are stored, condensed, filtered and displayed. You can view daily curves, compare measured variables and switch between scenarios.
What does it work with today?
Exclusively simulated data. The production system holds a complete simulated year of measurements: 6 scenarios, 13 measurement series and 9 measured variables, around 51 million individual values in total. Among them are bioelectrical traces at 250 values per second. Every view is permanently labeled as a simulation.
The biggest challenge: interference
Bioelectrical signals from mycelium are weak. They lie in the range of microvolts to millivolts and change slowly. In the field, they are easily overlaid by electrical interference, in everyday terms: noise. Causes include fluctuating electrode contact, changes in humidity and temperature, or electrical pickup. Anyone who wants to evaluate field measurements therefore has to be able to tell signal and interference apart first. Only then do statements about fungi make sense.
This is what the Data Lab is designed for
A dedicated scenario deliberately contains technical fault cases: a device restart with a recording gap, two days of missing data, an overdriven measurement amplifier, a time jump of the device clock and a sensor fault. Such disturbances are flagged in the data and made visible in the view, instead of being silently smoothed over or deleted. Missing values appear as a gap, never as zero. In the stimulation scenarios, a control series without stimulation also runs alongside each time. That way, a possible effect can later be distinguished from interference and natural fluctuations.
Whether and how well interference can actually be separated in the field can only be shown by real measurements. The Data Lab makes sure we won't have to start building the tools only then.
What does this tell us, and what doesn't it?
The test shows that storage, condensing and display also work under realistic load. It says nothing about biology. Anyone looking for patterns here will only find the patterns we calculated into it ourselves. That also applies to the fault cases: they, too, come from our simulation. The test shows that the system detects and flags known disturbances. Whether it reliably finds unknown disturbances in the field, it doesn't show.
What's next?
As soon as real measurement nodes deliver data, it will replace the simulation. The simulated data will not be archived, not mixed with measurement data and not used for AI training. We publish real measurement data under CC BY 4.0, so that science can verify it without having to trust us.
Try it out:
A preview with simulated data is available on the Data Lab's explainer page. The full Data Lab is open after free registration.